— Frequent user feedback, 2020
| Metric | Why |
|---|---|
| Recent updates | Helps track recent update bursts or regressions |
| Update type | Distinguishes patch (e.g., 1.2.3), minor (e.g., 1.2.0), and major (e.g., 1.0.0) updates |
| Count version | Measures churn and helps reduce risk of coinciding updates |
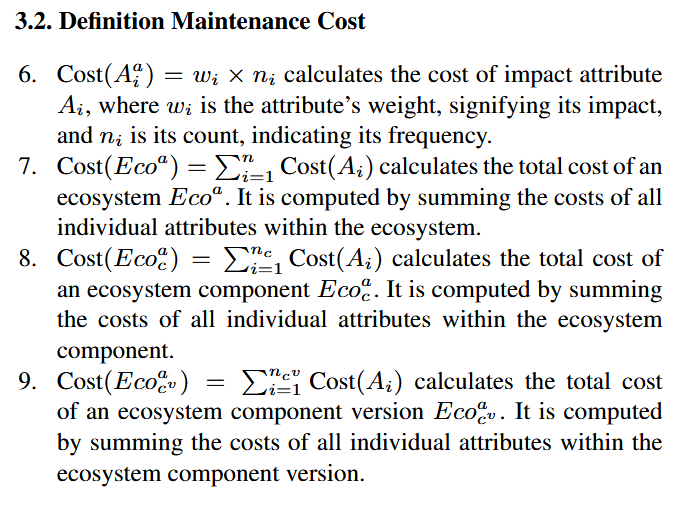
— Frequent user feedback, 2020
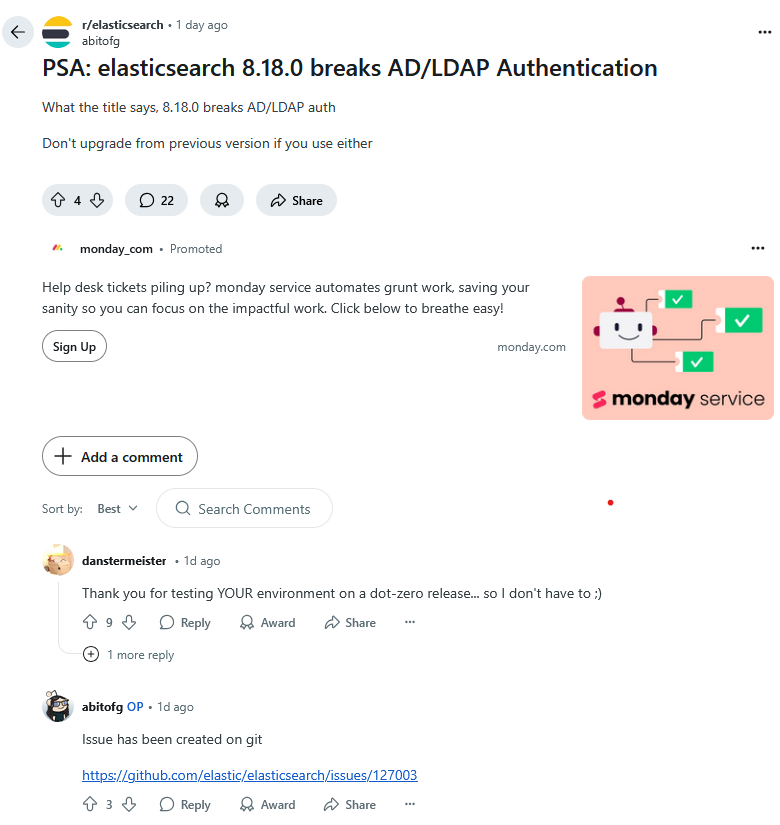
— Users feedback, 2023
| Metric | Why |
|---|---|
| Recent updates | Helps track recent update bursts or regressions |
| Update type | Patch (e.g., 1.2.3), minor (e.g., 1.2.0), and major (e.g., 1.0.0) updates |
| Count version | Measures churn and helps reduce risk of coinciding updates |
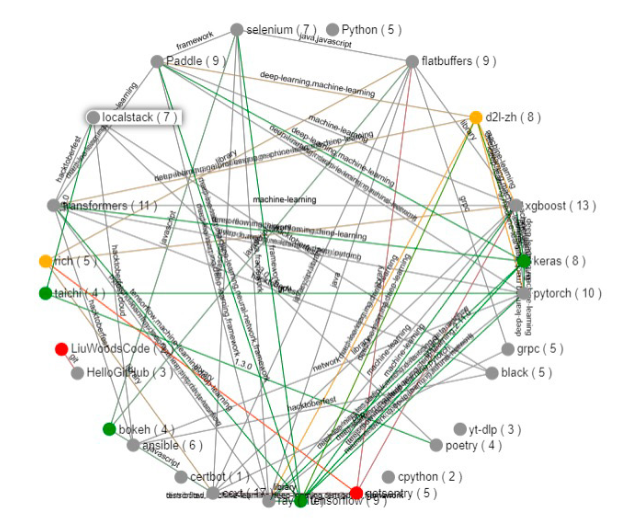
| Degree of node | Measures the number of association for each component |
— From component to component type, 2024
| Weighted Metric | Why |
|---|---|
| Recent updates | Helps track recent update bursts or regressions |
| Update type | Distinguishes patch (e.g., 1.2.3), minor (e.g., 1.2.0), and major (e.g., 1.0.0) updates |
| Count version | Measures churn and helps reduce risk of coinciding updates |
| Count edge | Measures dependency between components |
| Classify component | Measures churn and helps reduce risk of high impact component updates |
| Classify version | Measures churn and helps reduce risk of security / breaking updates |
| Weighted Metric | Why |
|---|---|
| Recent updates | Helps track recent update bursts or regressions |
| Update type | Distinguishes patch (e.g., 1.2.3), minor (e.g., 1.2.0), and major (e.g., 1.0.0) updates |
| Count version | Measures churn and helps reduce risk of coinciding updates |
| Count edge | Measures dependency between components |
| Classify component | Measures churn and helps reduce risk of high impact component updates |
| Classify version | Measures churn and helps reduce risk of security |
| Classify version | Measures churn and helps reduce risk of breaking updates |
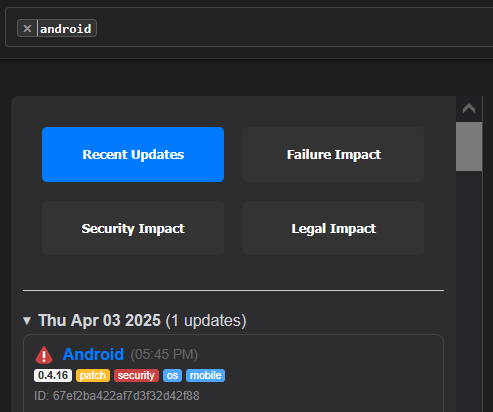
Increased Detection
Impact on Applications
— Architect question, 2025
| Author(s) | Summary | Data | Focus Area | Year |
|---|---|---|---|---|
| Luján-Mora et al. | Data Mapping Diagrams for Data Warehouse Design with UML | Introduces attribute-level mapping diagrams in UML to document ETL processes | Data warehouse design, UML integration | 2005 |
| Bali et al. | SoftArchViz | Automated software architecture visualization from source code and patterns | Dynamic software structure visualization | 2007 |
| Narawita et al. | Automated UML Generation using NLP | Generates use case and class diagrams from requirement texts using NLP | Requirements analysis, design automation | 2021 |
| Lyashenko et al. | Real-time Monitoring for Cyber-Physical Systems | Hardware/software integration for monitoring legacy production systems | Cyber-physical system visualization | 2023 |
| Gamage et al. | Automated Architecture Diagram Generator | Uses NLP with BERT and knowledge graphs to automate diagram creation | Software architecture, NLP automation | 2023 |
| Hamza et al. | Feature-driven Architecture Generation | Uses feature modeling to create configurable architectures for pervasive systems | Pervasive systems, feature modeling | 2012 |
| Renovate | GitHub Dependency Update Tool | Tracks and automates updates in GitHub repositories | Repository-specific update tracking | 2019 |
| Berhe et al. | Release Note Modeling and Impact-Driven Update Prioritization | Integrates release notes, CVEs, and Reddit data for multi-ecosystem update tracking and UML-Based visualization | Standardization, software maintenance, security-aware automation | 2025 |